[DATA]
The data that I used is from the Quandle.
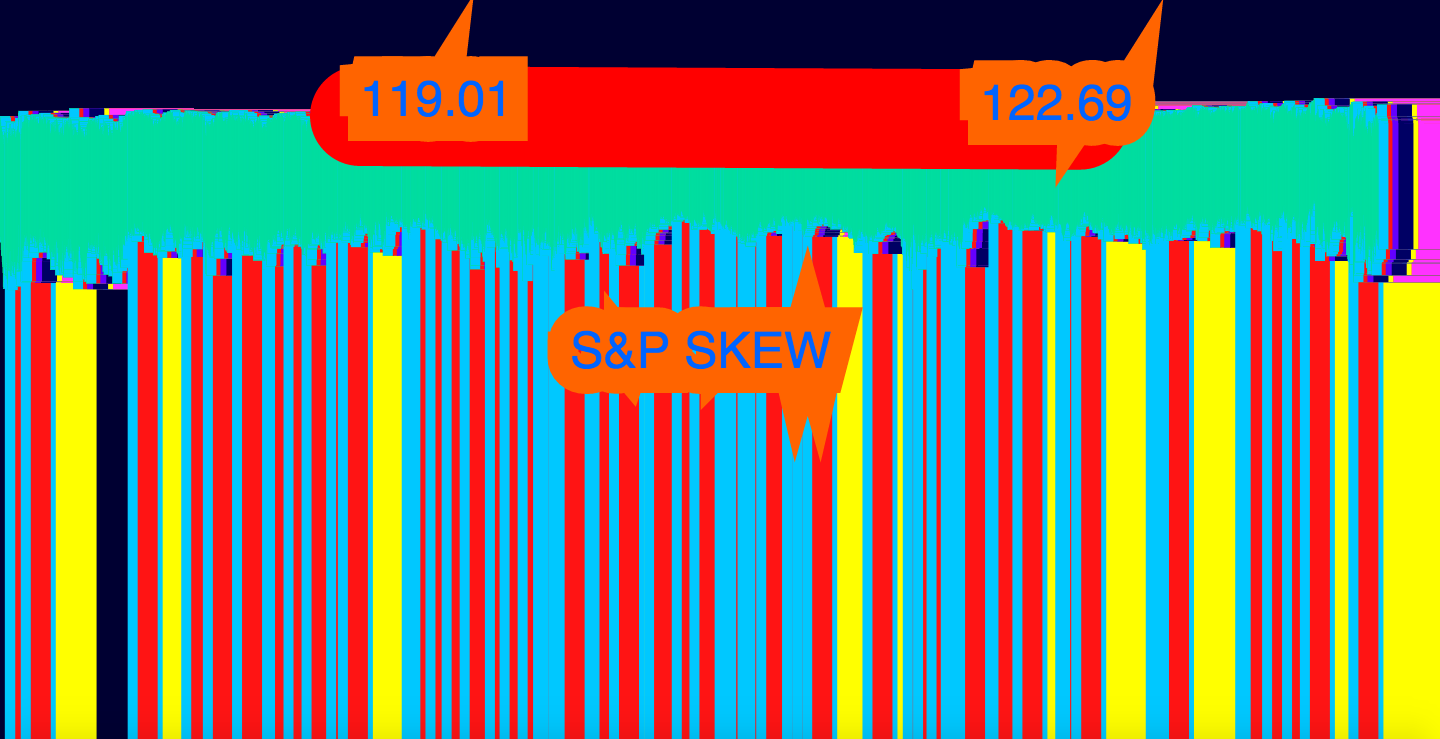
The rectangles have Y values from the S&P SKEW in year 1990. I wanted to have the JSON on live stock but it was difficult to find free. So I got this daily value. I used the last two recent value on the sketch to see daily difference.
S&P SKEW DAILY